

MDO32 Mixed Domain Oscilloscope
- ModelMDO32
- AttributesMixed Domain Oscilloscope
- Category TEKTRONIX > MDO3 Series Mixed Domain Oscilloscope
- BrandTEKTRONIX
- DescriptionAt the core of the 3 Series MDO is a world-class oscilloscope offering comprehensive tools that accelerate every stage of debugging, from quickly discovering and capturing anomalous events, to searching waveform records for events of interest, to analyzin
Detailed Introduction Technical Documents
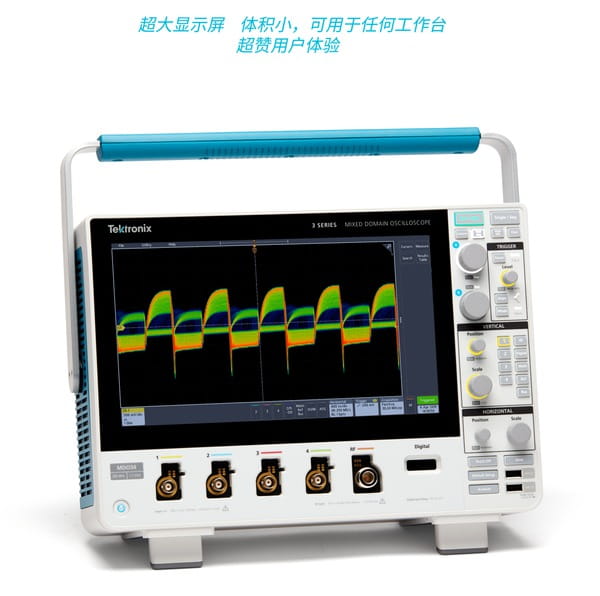
Key Specifications
2 analog channel and 4 analog channel models
100 MHz, 200 MHz, 350 MHz, 500 MHz, 1 GHz bandwidth models
Bandwidth upgradable (up to 1 GHz)
Up to 5 GS/s sample rate
10 M record length on all channels
Maximum waveform capture rate >280,000 wfm/s
Standard passive voltage probes, 3.9 pF capacitive loading with 250 MHz, 500 MHz or 1 GHz analog bandwidth
Spectrum analyzer (optional)
Frequency Range: 9 kHz - 1 GHz (Standard) or 3 GHz (Optional)
Ultra-wide capture bandwidth, up to 3 GHz
Arbitrary Function Generator (Optional)
13 pre-defined waveform types
50 MHz waveform generation
128 k record length for arbitrary waveform generator
250 MS/s sampling rate for arbitrary waveform generator
Digital Channels (Optional)
16 digital channels
10 M record length on all channels
121.2 ps timing resolution
Serial Bus Decoding, Trigger and Search (Optional)
Supports serial buses including I2C, SPI, RS-232/422/485/UART, USB 2.0, CAN, CAN FD, LIN, FlexRay, MIL-STD-1553, ARINC429 and audio standards
Digital Voltmeter/Frequency Counter (Free after product registration)
4-digit DC, AC RMS and DC+AC RMS voltage measurement
5-digit frequency measurement
Typical Applications
Embedded Design and IoT
Use 3 Series MDO to perform system-level debugging on mixed-signal embedded systems. It supports a variety of common serial buses, including the most widely used serial bus technologies today, helping you quickly identify and solve problems.
Power Design
With automated measurements for power quality, switching loss, harmonics, ripple, modulation and safe operating area, and a wide selection of power probes in a cost-effective solution, you can perform reliable, repeatable voltage, current and power measurements.
Education
Managing multiple instruments on a lab bench can be very cumbersome. 3 Series MDO features a compact form factor (5.9 inches, 149 mm deep), integrating analog measurement, digital measurement, RF measurement and a signal source in one unit. Its small size and high integration help you teach various electronic principles and conduct more comprehensive experiments. Full upgradability allows you to add functions when your requirements change or when your budget allows.
Manufacturing Test and Debug
Specification and space constraints can have a major impact on workshop operations. 3 Series MDO integrates multiple instruments into a single compact unit, minimizing required rack or bench space. This integration reduces the costs associated with using multiple separate instruments at manufacturing test or debug stations.
Installation and Maintenance Service
Having the right instrument available whenever and wherever you need it is critical. 3 Series MDO delivers analog waveform, digital logic and spectrum analysis capabilities in a lightweight (11.7 lb, 5.3 kg) portable unit, ideal for applications with limited space and requiring flexibility.
Next Generation Oscilloscopes
| 3 Series MDO | 4 Series MSO | 5 Series Mixed Signal Oscilloscope (MSO) | 6 Series MSO | |
|---|---|---|---|---|
| Bandwidth (Software Upgradable) | Up to 1 GHz | Up to 1.5 GHz | Up to 2 GHz | Up to 8 GHz |
| Vertical Resolution | 8 bit | 12 bit | 12 bit | 12 bit |
| Display | 11.6" HD | 13.3" HD | 15.6" HD | 15.6" HD |
| Input | TekVPI | FlexChannel / TekVPI | FlexChannel / TekVPI | FlexChannel / TekVPI |
| Advanced Analysis | Compliance Test / Jitter / Windows OS | Compliance Test / Jitter / Windows OS |
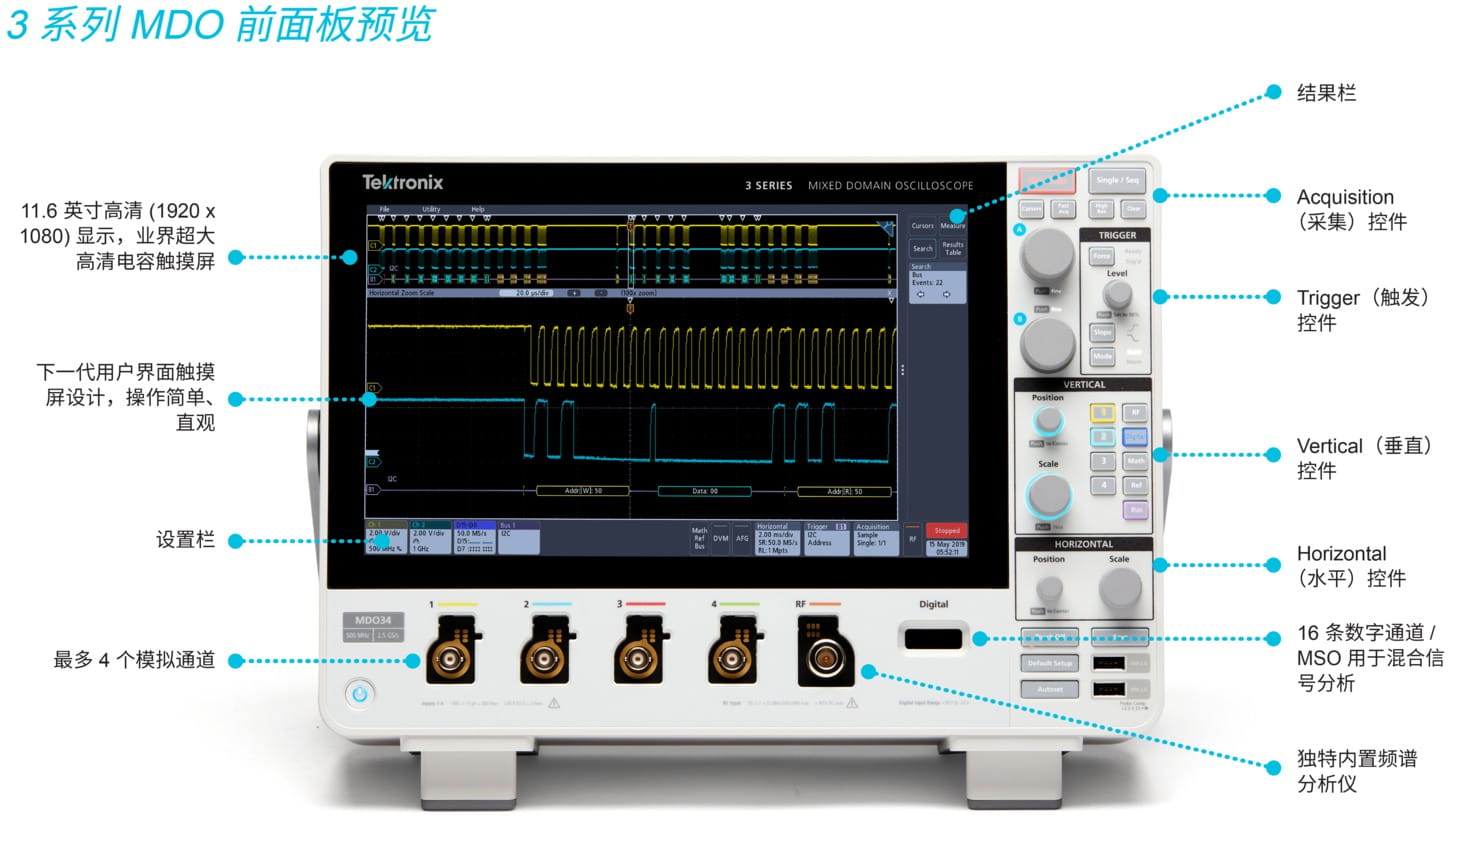
The exceptionally intuitive and user-friendly UI lets you focus on the task at hand
Settings Bar – Manage key parameters and waveforms
Located at the bottom of the display, the Settings Bar features a series of tabs that show waveforms and oscilloscope operating parameters. It provides direct access to common waveform management tasks. With just one tap, you can:
Turn on channels
Add Math Waveform
Add Reference Waveform
Add Bus Waveform
Enable 16 digital channels MSO
Enable Spectrum Analyzer
Enable integrated Arbitrary Waveform/Function Generator (AFG)
Enable integrated Digital Voltmeter (DVM)
Results Bar – Analysis and Measurement
The Results Bar on the right side of the display provides one-click access to the most commonly used analysis tools, such as cursors, measurements, search and bus decoding result tables.
The Results Bar displays tabs for cursors, measurements and search results without occupying any waveform viewing area. To increase the waveform viewing area, you can detach and re-dock the Results Bar at any time.
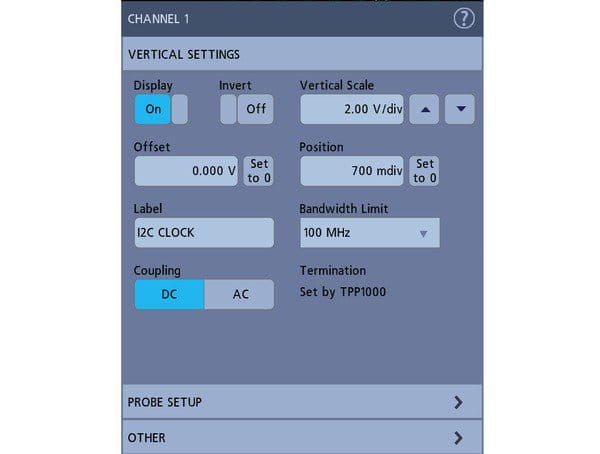
Just double tap the item of interest on the display to enter the configuration menu. In this example, double tapping the Channel label opens the channel configuration menu. Simply tap anywhere outside the menu and the menu will hide.
Brand New Touch Interaction
Oscilloscopes have adopted touchscreens for many years, but touchscreen user experience has always been an afterthought. The 3 Series MDO 11.6" display features a capacitive touchscreen, delivering a truly touch-optimized user interface.
3 Series MDO supports all the touch gestures you use on your smartphones and tablets, and delivers all the touch operations you expect on a touch-enabled device.
Drag the waveform left/right or up/down to adjust the horizontal and vertical position, or scroll to zoom the view
Use gestures to change the scale or zoom in/out in horizontal or vertical direction
Swipe in from the right to show the results bar; swipe down from the top to enter the menu at the top-left corner of the display
The smooth, fast-responsive front panel controls can be adjusted via familiar knobs and buttons, and mouse or keyboard can be added as a third interaction mode.
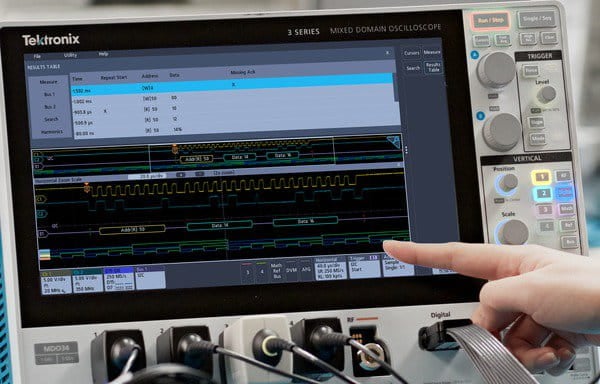
The interaction on the capacitive touch display is the same as that on mobile phones and tablets.
Powerful Waveform Capture and Analysis
The 3 Series MDO is built around a world-class oscilloscope, providing comprehensive tools that speed up every stage of debugging: from quickly detecting and capturing anomalous events, to searching waveform records for events of interest, to analyzing event characteristics and device behavior.
Digital Phosphor Technology and FastAcq™ High-Speed Waveform Capture
When debugging design issues, the first step is confirming that a problem exists. Every design engineer spends lots of time locating problems in the circuit, and this task can be extremely time-consuming and troublesome without proper debugging tools.
Digital Phosphor Technology enables you to quickly grasp the actual operating status of your device. Its fast waveform capture rate reaches >280,000 wfms/s in FastAcq mode, allowing you to quickly identify common intermittent issues in digital systems with high probability: runt pulses, glitches, timing errors and more.
To further enhance the capability of viewing intermittent events, intensity grading is used to indicate the occurrence frequency of intermittent transient events compared with normal signal characteristics. 4 waveform palettes are available in FastAcq acquisition mode.
Color Temperature Palette uses color grading to indicate occurrence frequency: warm colors such as red/yellow represent frequently occurring events, and cool colors such as blue/green represent rarely occurring events.
Spectral Palette uses color grading to indicate occurrence frequency: cool colors such as blue represent frequently occurring events, and warm colors such as red represent rarely occurring events.
Normal Palette uses default channel colors (e.g. yellow for Channel 1) and gray levels to indicate occurrence frequency, where frequently occurring events are displayed in brighter colors.
Inverted Palette uses default channel colors and gray levels to indicate occurrence frequency, where rarely occurring events are displayed in brighter colors.
These palettes quickly highlight high-frequency events during measurement, or highlight low-frequency events when measuring intermittent anomalous events.
Infinite Persistence or Variable Persistence options determine how long the waveform remains on the display, helping you determine the occurrence frequency of anomalous events.
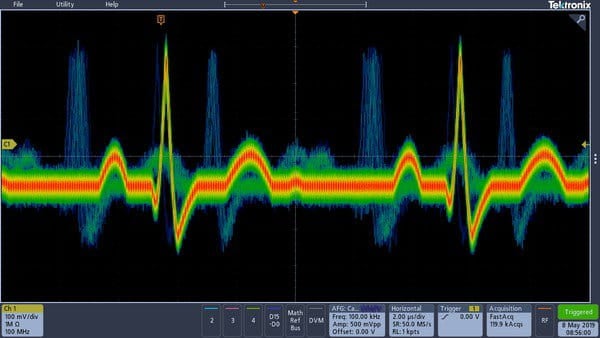
Digital Phosphor technology and FastAcq deliver >280,000 wfms/s waveform capture rate and real-time color intensity grading.
Trigger
Identifying a circuit problem is only the first step. Next, you must capture the corresponding event to determine the root cause. To enable this, 3 Series MDO includes over 125 trigger combinations and provides a complete set of triggers, including runt pulse trigger, logic trigger, pulse width/glitch trigger, setup and hold violation trigger, serial packet trigger and parallel data trigger, helping you quickly isolate the event of interest. With up to 10 M record length, you can capture numerous events of interest, even thousands of serial packets in a single acquisition for further analysis, while maintaining high resolution that allows you to zoom in to view fine signal details.
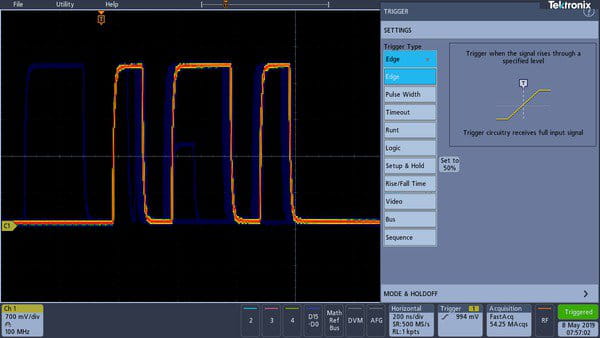
Over 125 trigger combinations to easily capture events of interest.
Basic Waveform Analysis and Automatic Measurement
To verify that prototype performance matches simulation results and meets the project design objectives, thorough analysis is required, ranging from simple checks of rise time and pulse width to comprehensive analysis of power consumption, system clock characterization, and noise source investigation.
3 Series MDO provides a complete set of standard analysis tools, including:
Waveform-based cursors and screen-based cursors
Up to 8 types of automatic measurement
Basic waveform math operations
Basic FFT Analysis
Advanced waveform math operations with formula editor
The Measurement Results Table allows comprehensive statistics and viewing of measurement results.
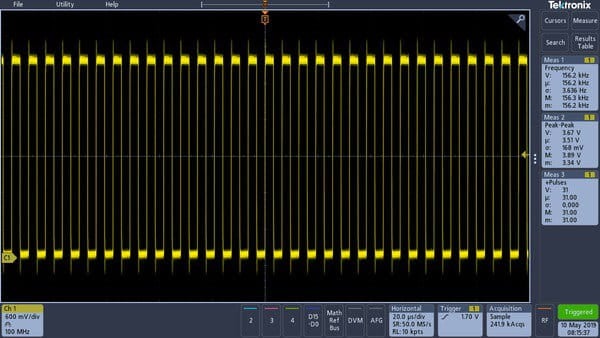
Automatically measures frequency, peak-to-peak value and number of positive pulses, and displays statistics.
Convenient Navigation and Search
Without proper search tools, locating a target event in a long waveform record can take a great deal of time. With modern record lengths holding millions of data points, locating an event may require scrolling through thousands of screens of signal activity.
3 Series MDO provides the industry's most comprehensive search and waveform navigation capabilities through its new on-screen controls. These functions speed up panning and zooming of recorded waveforms. You can navigate back and forth within the area of interest in long records using intuitive pinch gestures on the display or the multi-purpose knob.
The search function automatically scans long acquisition data to find user-defined events. All time points where events occur are highlighted with search marks, and you can easily navigate between them using the Previous ( ← ) and Next ( → ) buttons in the Search tab on the display. Search types include edge, pulse width, timeout, runt pulse, logic, setup time, hold time, and parallel/serial bus packet content.
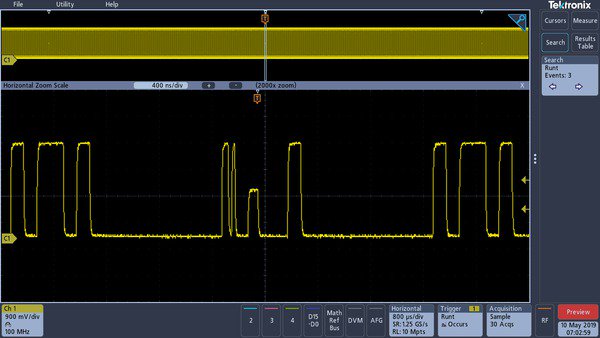
FastAcq helps you identify runt pulses in digital data streams for further investigation. In this test case, 3 runt pulses were found and marked in a 10 M point acquisition.
Comprehensive Power Analysis (Optional)
With growing customer demand for devices with longer battery life and green solutions with lower energy consumption, power designers need to characterize switching losses and minimize them to improve efficiency. In addition, characterization of power level, output purity and harmonic feedback to the power line is required to comply with national and regional power quality standards. Historically, performing these and many other power measurements on an oscilloscope was quite time-consuming, requiring manual operation and was very tedious. The optional power analysis tool for 3 Series MDO greatly simplifies these tasks, enabling fast, repeatable and accurate analysis of power quality, switching loss, harmonics, safe operating area (SOA), modulation, ripple and slew rate (di/dt, dv/dt). The power analysis tool is fully integrated in the oscilloscope, and automated repeatable power measurement can be done with just one button click. The optional power analysis function offers a free 30-day trial. This free trial period starts automatically when the instrument is powered on for the first time.
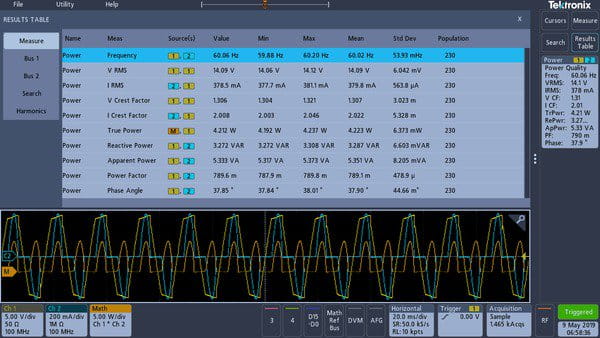
Power quality measurement table. Automated power measurement enables rapid and accurate analysis of common power parameters.
Exclusive Built-in Spectrum Analyzer (Optional)
Tektronix MDO series is an oscilloscope that provides hardware-based integrated spectrum analyzer. The spectrum analyzer of 3 Series MDO has a frequency range of 9 kHz to 1 GHz (standard) or 3 GHz (Option 3-SA3), which can perform spectrum analysis for IoT and most consumer wireless standards.
Fast and Accurate Spectrum Analysis
When using the standard N connector input of the spectrum analyzer, the 3 Series MDO display switches to a full-screen spectrum analyzer view.
Key spectrum parameters, such as center frequency, frequency span, reference level and resolution bandwidth, can be adjusted quickly and easily via the dedicated front-panel menu and keypad.
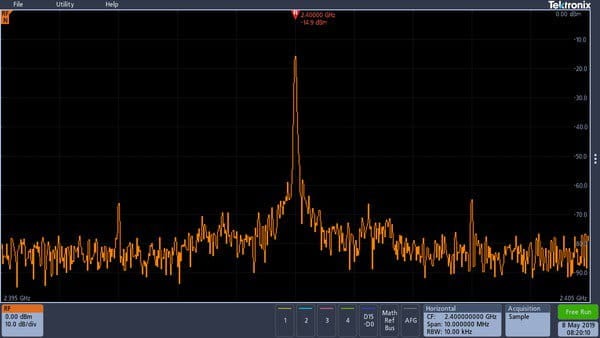
3-Series MDO Frequency Domain Display.
Smart and Efficient Markers
In traditional spectrum analyzers, enabling and placing enough markers to identify all peaks of interest can be very time-consuming. 3-Series MDO greatly improves the efficiency of this process by automatically placing markers on peaks and indicating the frequency and amplitude of each peak. Users can adjust the standard settings that define what counts as a peak.
The peak with the highest amplitude is called the reference marker, and it is displayed in red. Marker readings can be toggled between absolute values and relative values. When relative values are selected, marker readings display the relative frequency and relative amplitude of each peak with respect to the reference marker.
The 3 Series MDO also provides two manual cursors for measuring non-peak portions of the spectrum. When enabled, one cursor is linked to a reference marker, allowing relative measurements to be completed anywhere on the spectrum. In addition to frequency and amplitude, cursor readings also include noise density and phase noise readings, depending on whether absolute or relative readings are selected. The "Reference Marker to Center" function instantly moves the frequency indicated by the reference marker to the center frequency.
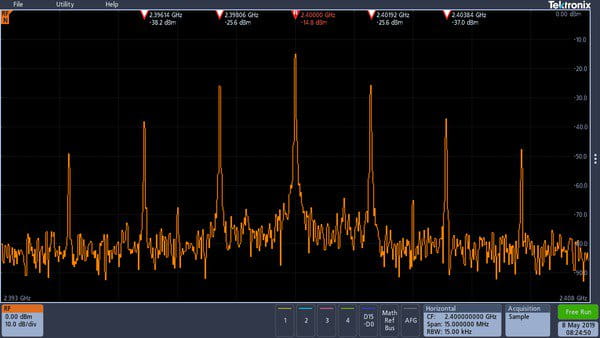
Automatic peak markers identify key information at a glance. As shown here, the five highest-amplitude peaks that meet the threshold and drift specifications are automatically marked, and the frequency and amplitude of each peak are also displayed.
Spectrogram
3 Series MDO includes a 3D spectrogram view, which is especially ideal for slowly changing RF phenomena. The X-axis represents frequency, just like a typical spectrum view. However, the Y-axis represents time, and color is used to indicate amplitude.
The 3D spectrogram is generated as follows: each spectrum is acquired first, then "laid on edge" one pixel row at a time, and each pixel is assigned a color based on the amplitude at that frequency. Cool colors (blue and green) represent low amplitude, while warm colors (yellow and red) represent high amplitude. Each new acquisition adds a new segment at the bottom of the spectrogram, and the historical record shifts up by one row. When acquisition stops, you can scroll back through the spectrogram to view each frequency segment.
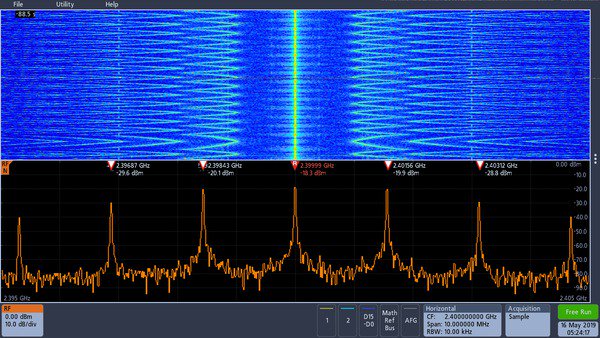
The spectrogram display shows slowly moving radio frequency phenomena. What shown here is a signal with multiple peaks under monitoring. When the frequency and amplitude of the peaks change over time, the changes can be easily observed on the spectrogram display.
Ultra-Wide Capture Bandwidth
Today's wireless communication standards are evolving rapidly, they employ sophisticated digital modulation methods and usually adopt transmission technologies involving output bursts. Meanwhile, the bandwidth of these modulation schemes can also be very wide. Traditional swept or stepped spectrum analyzers have very limited capability to view these types of signals, because they can only capture a small portion of the spectrum at a time.
The amount of spectrum acquired in one single acquisition is called capture bandwidth. Traditional spectrum analyzers implement capture bandwidth in swept or stepped mode, building the requested display across the required frequency range. Therefore, when the spectrum analyzer is acquiring one portion of the spectrum, the event of interest may be occurring in another portion of the spectrum. Most spectrum analyzers on the market today provide a capture bandwidth of 10 MHz, and sometimes an expensive option is available to extend it to 20 or 40 MHz, and in some cases up to 160 MHz.
To meet the bandwidth requirements of modern RF applications, 3 Series MDO provides capture bandwidth up to 3 GHz. The full spectrum is generated from one single acquisition, ensuring you can see all events you are looking for in the frequency domain.
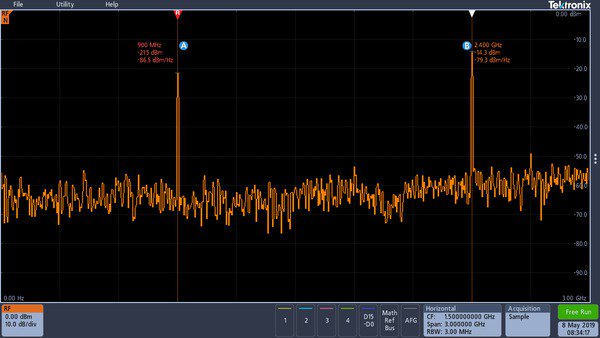
Whether it is burst communication to a device via Zigbee at 900 MHz, or burst communication from a device via Bluetooth at 2.4 GHz, the spectral display of the burst communication can be captured in a single acquisition.
Spectrum Traces
3 Series MDO spectrum analyzer offers four different traces or views, including Normal, Average, Ma
