

MDO3000 Series Mixed Domain Oscilloscope
- ModelMDO3014/MDO3022/MDO3024/MDO3032 MDO3034/MDO3052/MDO3102/MDO3054/MDO3104
- AttributesMixed Domain Oscilloscope
- Category TEKTRONIX > MDO3000 Series Mixed Domain Oscilloscope
- BrandTEKTRONIX
- DescriptionThe MDO3000 mixed domain oscilloscope (MDO) series is the ultimate 6-in-1 integrated oscilloscope, combining a spectrum analyzer, arbitrary function generator, logic analyzer, protocol analyzer and digital voltmeter/counter. The MDO3000 series is fully cu
Detailed Introduction Technical Documents
Excellent 6-in-1 integrated oscilloscope, fully customizable and fully upgradable
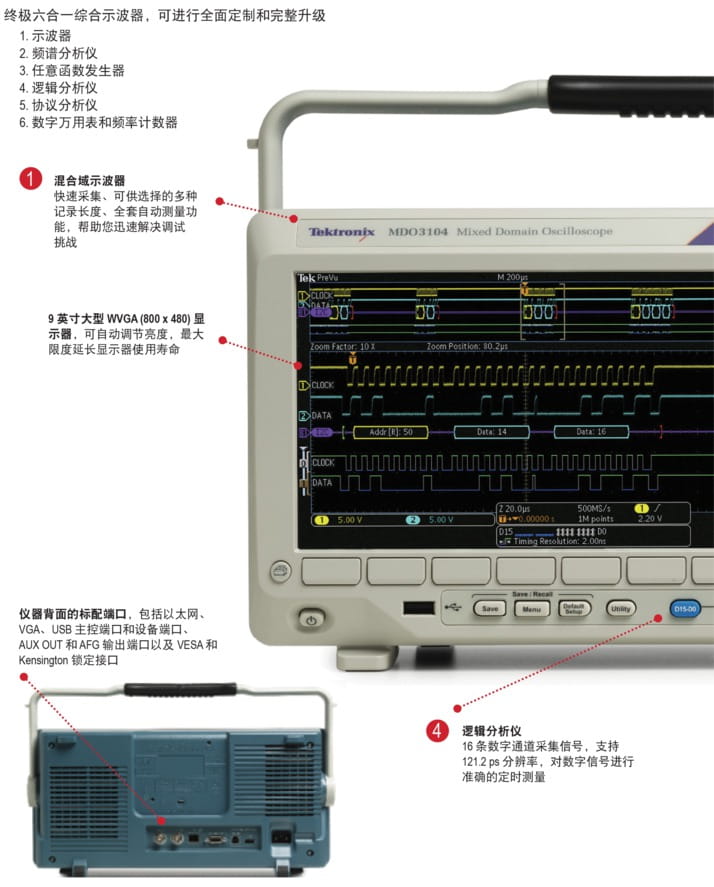
Today's integrated designs require oscilloscopes with matching integration level, such as the MDO3000 Mixed Domain Oscilloscope (MDO) series. This is an outstanding 6-in-1 oscilloscope that integrates a spectrum analyzer, an arbitrary function generator, a logic analyzer, a protocol analyzer, and a digital voltmeter/counter. The MDO3000 series is fully customizable and fully upgradable, you can add instruments and performance now or when you need it in the future.
Key Specifications
1. Oscilloscope
Available in two models: 2 analog channels and 4 analog channels
Available with bandwidth options of 1 GHz, 500 MHz, 350 MHz, 200 MHz and 100 MHz
Bandwidth upgradable (up to 1 GHz)
Sampling rate up to 5 GS/s
10 M record length on all channels
Maximum waveform capture rate of >280,000 wfm/s
Standard passive voltage probes, 3.9 pF capacitive loading, analog bandwidth of 1 GHz, 500 MHz or 250 MHz
2. Spectrum Analyzer
Standard: 9 kHz - Oscilloscope bandwidth
Optional: 9 kHz - 3 GHz
Frequency Range
Ultra-high capture bandwidth, up to 3 GHz
3. Arbitrary Function Generator (Optional)
13 predefined waveform types
50 MHz waveform generation capability
128 k record length for arbitrary waveform generator
250 MS/s sampling rate for arbitrary waveform generator
4. Logic Analyzer (Optional)
16 digital channels
10 M record length on all channels
121.2 ps timing resolution
5. Protocol Analyzer (Optional)
Supports serial buses including I2C, SPI, RS-232/422/485/UART, USB 2.0, CAN, CAN FD, LIN, FlexRay, MIL-STD-1553, ARINC-429 and audio standards, etc.
Digital Voltmeter/Frequency Counter (provided free after product registration)
4 digit AC RMS, DC and AC+DC RMS Voltage Measurement
5 digit Frequency Measurement
Typical Applications
Embedded Design
The 6-in-1 MDO3000 supports all common serial buses, enabling you to perform system-level debugging on mixed-signal embedded systems to quickly identify and resolve issues, covering all common serial bus technologies.
Power Design
With automated measurements of power quality, switching loss, harmonics, ripple, modulation and safe operating area, and a wide selection of power probes in a cost-effective solution, it delivers reliable, repeatable voltage, current and power measurements.
Education
Managing multiple instruments on a workbench can be very cumbersome. The MDO3000 integrates six instruments into one compact unit (5.8 inches, 147.4 mm deep), eliminating the hassle of managing multiple instruments. Its small size and high integration help you teach various electronic principles and conduct more comprehensive experiments. Full upgradability allows you to add functionality when your requirements change or when your budget allows.
Manufacturing Test and Debug
Size and space constraints can create huge impacts on the production floor. The unique 6-in-1 MDO3000 integrates multiple instruments into one unit, minimizing the rack or workbench space occupied. This integration reduces the costs associated with using multiple different instruments in manufacturing test or debug stations.
Installation and Maintenance Services
Having the right instrument available whenever and wherever you need it is critical. The MDO3000 combines six instruments into a single lightweight (9.2 lbs, 4.2 kg) portable unit – making it an ideal choice for scenarios where space is limited and flexibility is required.
Need Higher Performance?
|
|
|
| |
|---|---|---|---|---|
| MSO/DPO2000B | MDO3000 | MDO4000C | MSO/DPO5000B | |
| Advanced Description | Cost-effective Advanced Debug Functions | Integrated Oscilloscope with Six Instruments in One | View analog, digital and RF signals synchronously | Outstanding signal fidelity, advanced analysis and math operations |
| Typical Applications |
|
|
|
|
| Analog Bandwidth | 70 MHz、100 MHz、200 MHz | 100 MHz、200 MHz、350 MHz、500 MHz、 1 GHz | 200 MHz、350 MHz、500 MHz、 1 GHz | 350 MHz、500 MHz、1 GHz、 2 GHz |
| Maximum Analog Sampling Rate | 1 GS/s | 5 GS/s | 5 GS/s | 10 GS/s |
| Analog Channels | 2、4 | 2、4 | 4 | 4 |
| Record Length | 1 M | 10 M | 20 M | 25 M (Optional) up to 125 M |
| Number of Digital Channels | (Optional) 16 | (Optional) 16 | 16 | (Optional) 16 |
| Spectrum Analyzer Channels | None | (Standard) 9 kHz - Analog Bandwidth; (Optional) 9 kHz - 3 GHz | (Optional) 9 kHz - 3 GHz; (Optional) 9 kHz - 6 GHz | None |
| AFG | None | Up to 50 MHz, with 13 functions and arbitrary waveform generation capabilities | None | None |
| Serial Bus Analysis | Trigger and Decode: I 2 C, SPI, RS-232/422/485/UART, CAN, LIN | Trigger and Decode: I 2 C, SPI, RS-232/422/485/UART, CAN, CAN FD, LIN, FlexRay, USB2.0, MIL-STD-1553, ARINC-429, Audio | Trigger and Decode: I 2 C, SPI, RS-232/422/485/UART, CAN, CAN FD, LIN, FlexRay, USB2.0, MIL-STD-1553, ARINC-429, Audio | Trigger and Decode: I 2 C, SPI, RS-232/422/485/UART, CAN, LIN, FlexRay, USB2.0, Ethernet, MIL-STD-1553 Decode Only: USB-HSIC, MIPI D-PHY Compliance: BroadR-Reach, USB2.0, USB-PWR, Ethernet, MOST |
| Advanced Analysis | Power, Limit/Mask, Video | Power, Limit/Mask, Video, Spectrogram, Vector Signal Analysis | Power, Limit/Mask, Video, Vector Signal Analysis, Jitter | |
| Standard Probes | 100 MHz、12 pF or 200 MHz、12 pF | 200 MHz、3.9 pF 500 MHz、3.9 pF or 1 GHz、3.9 pF | 200 MHz、3.9 pF 500 MHz、3.9 pF or 1 GHz、3.9 pF | 500 MHz、3.9 pF or 1 GHz、3.9 pF |


1 – Oscilloscope
At the core of the MDO3000 Series oscilloscope is a world-class oscilloscope that provides comprehensive tools to speed up every stage of debugging, from quickly detecting and capturing anomalous events, searching waveform records to locate events of interest, to analyzing their characteristics and the behavior of the device under test.
Digital Phosphor Technology and FastAcq® High-Speed Waveform Capture
To debug design issues, you first need to know that a problem exists. Every design engineer spends a lot of time hunting for problems in circuits. Without proper debugging tools, this task is time-consuming and very troublesome.
Digital Phosphor Technology allows you to quickly understand the actual operating condition of your device. Its fast waveform capture rate exceeds 280,000 wfms/s when FastAcq is enabled, enabling you to quickly spot common intermittent issues in digital systems, such as runt pulses, glitches, timing errors and more, with a very high probability.
To further enhance the capability of viewing intermittent events, intensity grading can be used to indicate how often intermittent transient events occur compared to normal signal characteristics. 4 waveform palettes are available in FastAcq acquisition mode.
Color Temperature Palette uses color grades to indicate occurrence frequency: warm colors such as red/yellow represent frequently occurring events, while cool colors such as blue/green represent rarely occurring events.
Spectrum Palette uses color grades to indicate occurrence frequency: cool colors such as blue represent frequently occurring events, while warm colors such as red represent rarely occurring events.
Standard Palette uses default channel colors (e.g. yellow for Channel 1) and gray scale to indicate occurrence frequency, where frequently occurring events are represented by bright colors.
Inverted Palette uses default channel colors and gray scale to indicate occurrence frequency, where rarely occurring events are represented by bright colors.
These palettes quickly highlight events with high occurrence frequency during measurement, or highlight low-frequency events when measuring occasional abnormal events.
The Infinite Persistence or Variable Persistence option determines how long the waveform remains on the display, helping you determine the occurrence frequency of abnormal events.
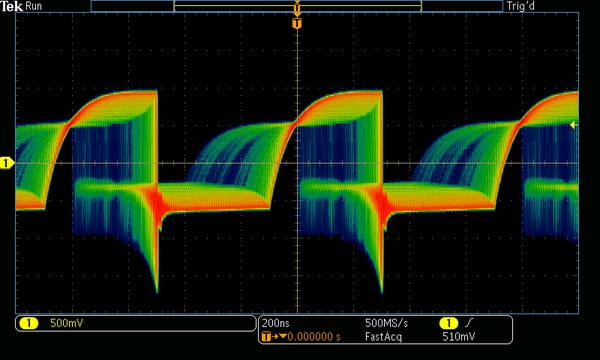
Digital Phosphor Technology with FastAcq delivers a waveform capture rate of > 280,000 wfms/s and real-time color intensity grading.
Trigger
Detecting device issues is only the first step. You must then capture events of interest to identify the root cause. To achieve this, the MDO3000 Series features over 125 trigger combinations and provides a complete set of trigger capabilities, including runt pulse trigger, logic trigger, pulse width/glitch trigger, setup/hold violation trigger, serial packet trigger and parallel data trigger, helping you quickly locate events of interest. With a record length of up to 10 M points, you can capture numerous events of interest in a single acquisition, even thousands of serial packets, for further analysis, while retaining high resolution to zoom in and examine fine signal details.
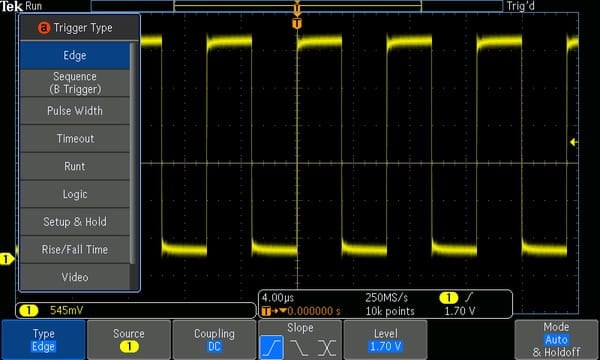
More than 125 trigger combinations allow you to easily capture the events you care about.
Wave Inspector® Wave Navigation and Automatic Search
With long record length, a single acquisition can contain tens of thousands of screens of waveform data. As a leading navigation and search tool, Wave Inspector® can locate the events you care about in just seconds.
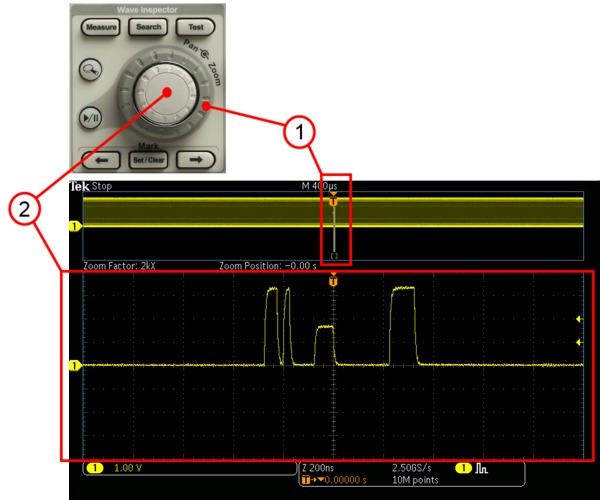
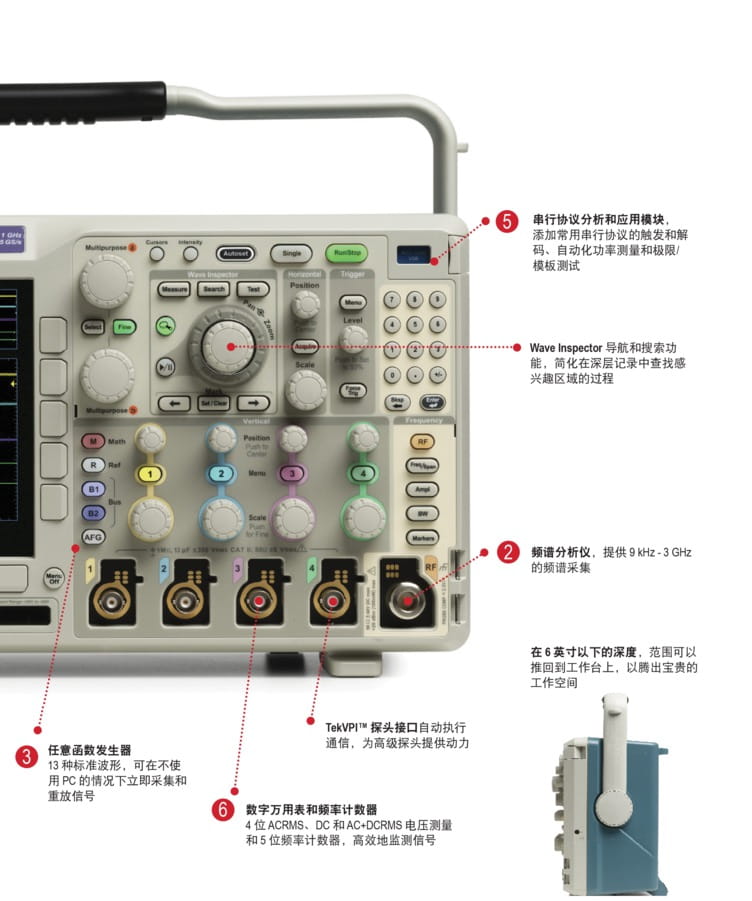
Wave Inspector controls deliver unprecedented efficiency when viewing, navigating and analyzing waveform data. By turning the outer scroll control (1), you can quickly browse through long records. It only takes a few seconds to go from start to end and locate the detailed information you need. Found the area of interest and need to see more detail? Just turn the inner zoom control (2).
Zoom and Scroll
This dedicated two-layer front panel control provides intuitive control for zoom and scroll. The inner control adjusts the zoom factor (or zoom scale): turning clockwise activates zoom and gradually increases the zoom factor, while turning counter-clockwise decreases the zoom factor, and will eventually turn off zoom. You no longer need to navigate through multiple menus to get a zoomed display. The outer control scrolls the zoom box through the waveform to quickly reach the area of interest, and it uses force feedback to adjust the scrolling speed through the waveform. The faster you rotate the outer control, the faster the zoom box moves. Simply turn it in the opposite direction to change the scroll direction.
User Markers
Press the Set Mark (Set Marker) button on the front panel to place one or more markers on the waveform. To navigate between these markers, simply press the Previous (←) (Previous) and Next (→) (Next) buttons on the front panel.
Search Markers
The Search (Search) button enables automatic search of long acquisitions for user-defined events. All occurrence locations of events are highlighted with search markers, and can be easily navigated via the Previous (←) (Previous) and Next (→) (Next) buttons on the front panel. Searchable types include edge, pulse width/glitch, timeout, runt, logic, setup and hold, rise/fall time, parallel bus and I2C, SPI, RS-232/422/485/UART, USB 2.0, CAN, CAN FD, LIN, FlexRay, MIL-STD-1553, ARINC-429 and audio packet contents. The search marker table displays events found during automatic search in tabular format. Each event is shown with a time stamp to enable easy timing measurement between events.
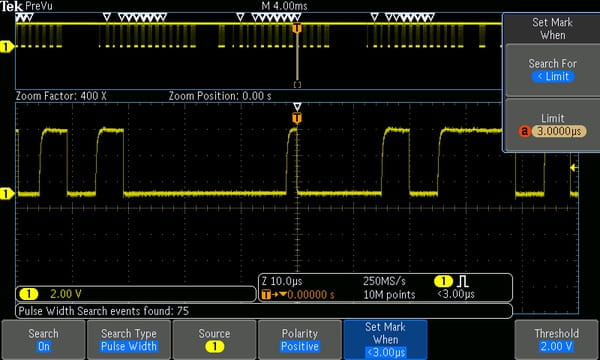
Search Step 1: Define what you want to search.
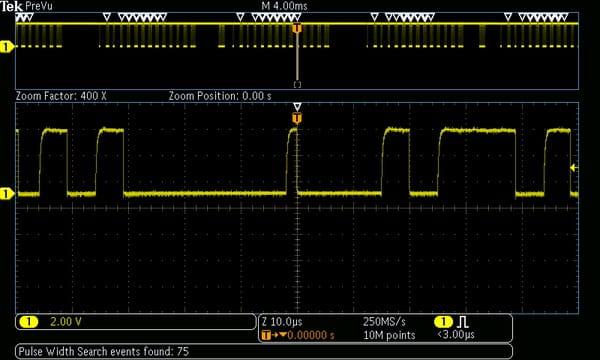
Search Step 2: Wave Inspector automatically searches the entire record, and marks each event with a hollow white triangle. You can then use the Previous and Next buttons to navigate between events.
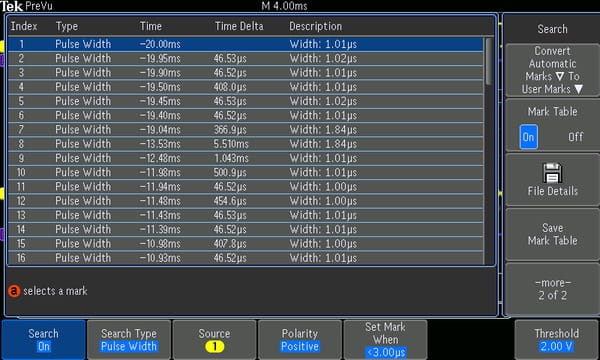
Search Step 3: The Search Mark table presents each event found through the automatic search process in table view. Each event is displayed with a time stamp for easy timing measurement between events.
Waveform Analysis
It analyzes the behavior of the prototype to verify whether its performance matches simulation data and meets the project design objectives. These tasks range from simple rise time and pulse width checks to complex power consumption analysis and noise source investigation.
Oscilloscopes provide comprehensive integrated analysis tools, including waveform-based and screen-based cursors, automatic measurements, and advanced waveform math operations (including arbitrary formula editing, FFT analysis, waveform histograms and trend plots), which visually display the change of measurement results over time.
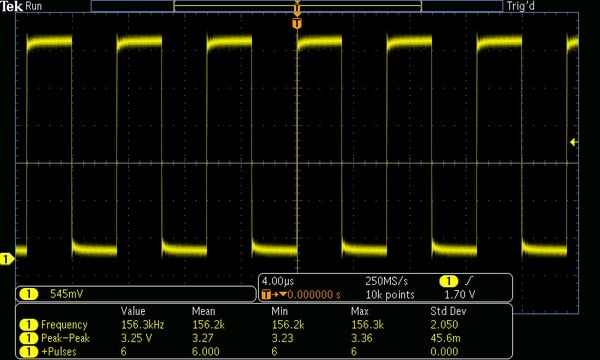
Automatic measurement readings provide repeatable statistical views of waveform characteristics.
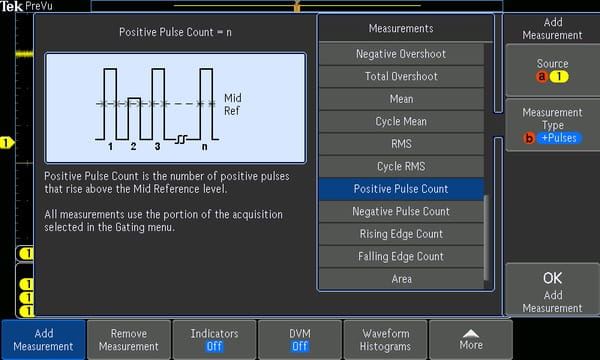
Each measurement comes with help text and corresponding graphics explaining how to perform the measurement.
Waveform histograms intuitively display how a waveform changes over time. Horizontal waveform histograms are especially suited for gaining insight into how much jitter is in a clock signal and the jitter distribution, while vertical histograms are ideal for understanding how much noise is in a signal and the noise distribution.
Waveform Histogram measurement provides analysis information related to waveform histogram distribution, allowing you to deeply understand the spread, standard deviation, average value and other parameters of the distribution.
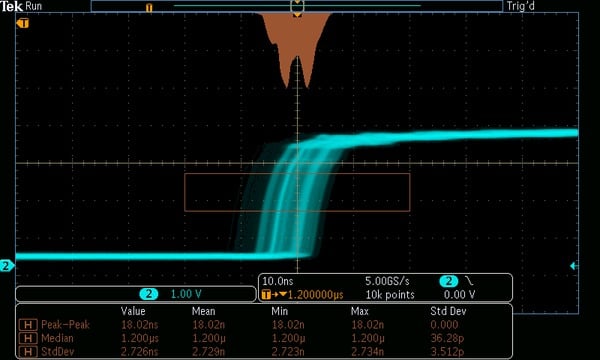
The waveform histogram for rising edges shows the distribution of edge position (jitter) over time, and includes digital measurement performed on the waveform histogram data.
